Trying to figure out exactly how much time your EV charging takes can feel super easy. You’ll use a tool or do it in your head – you know your current and target State of Charge (SoC), your car’s battery size and the charging power, and… voilà. 32 minutes, that’s what you’ll need.
And then you go and start the charge, come back to the car after 32 minutes, and…
The car has charged only half of what you expected.
While not always the case, this is more common than you’d think.
And it’s not because the charger is faulty (rarely ever is) – it’s that your expectations, calculations didn’t have some specific conditions backed in. The advertised fast charging rate in the vehicle specifications showcases the ideal conditions, and as we know, the real world tends to throw us the less-than-ideal ones often enough.
At Eleport, we like charging time calculators as a starting point. They’re useful to compare options, plan trips, and understand rough charging times. But they are built on simplified assumptions that rarely match real conditions on the road – or in winter.
Here’s everything you should consider when trying to estimate your charging time.
What charging time calculators actually do
Most calculators follow a very simple formula:
- Take your battery capacity in kWh.
- Estimate the energy you need to add (based on start and target SoC).
- Divide by the charger’s rated power in kW.
Example:
You want to add 40 kWh at a “50 kW” charger.
40 kWh ÷ 50 kW = 0.8 hours → 48 minutes.
Oh wow, that was easy, huh?
There are some hidden assumptions already in this calculation:
- The charger will actually deliver 50 kW the whole time.
- Your car will accept that power for the entire session (important).
- Conditions are ideal: moderate temperature, no shared power, no grid limits, no software constraints.
In our real world, however, there are a lot more factors affecting EV charging speed to consider, like:
- Your car’s charging curve changes with SoC.
- The battery temperature may be too cold or too hot.
- The site may be using dynamic load management to share power, and thus limit yours.
- Your car’s own hardware may be limiting the speed long before the charger does.
Below, we’ll take a look at these factors one by one.
Your car, not just the charger, decides the EV charging speed
Some of the factors affecting EV charging speed are already set from the factory. On the vehicle brochure in the specifications sheet, you might read something like:
“10% to 80% charge in 18 minutes on a 350 kW charger.”
This is a sample from the Ioniq 5 spec sheet.
This language use makes it look like you’re using the full 350 kW to charge. But in reality, the Ioniq 5 itself tops out around 263 kW peak, with an average power closer to 205 kW over that 10–80% window. The rest is clever marketing: the charger can do 350 kW, but your car won’t necessarily use that.
Charging time calculators that just take “350 kW” as the power input ignore your car’s maximum DC charging limit and the fact that power changes over the session (the charging curve).
Different cars, different charging power ceilings
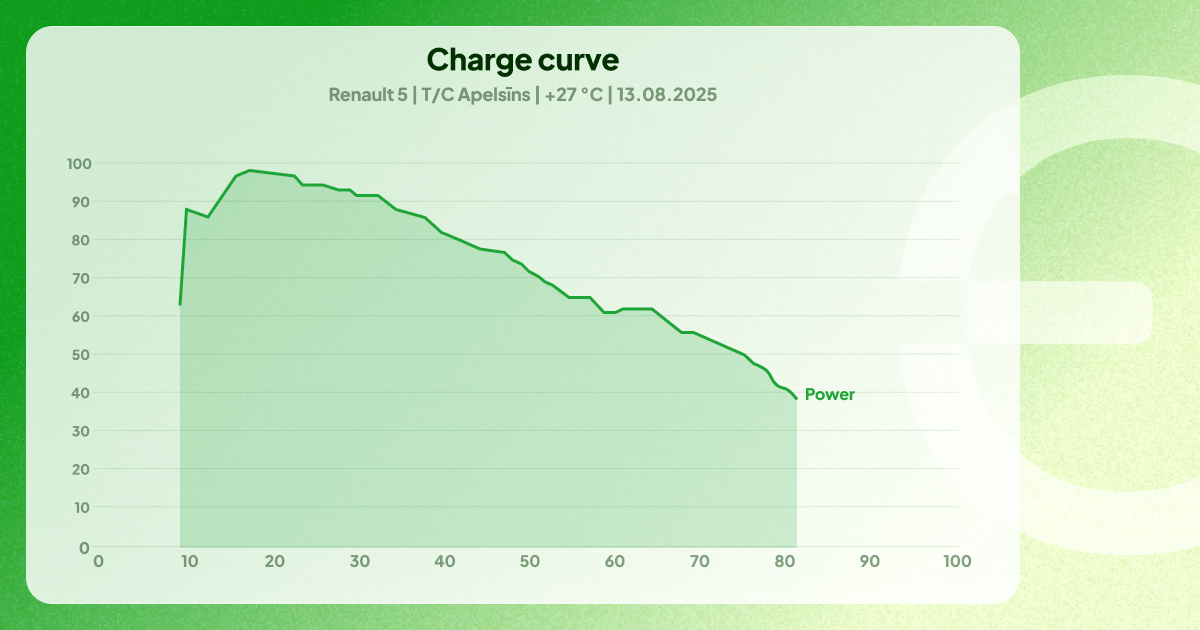
Not every new EV is a 200–300 kW “charging monster”. Take the new Renault 5, one of the best-selling EVs in Europe this year, as an example: its peak charging power is at 100 kW. As with many entry-level EVs these days.
And that peak only happens in a certain state of charge window, which then drops as SoC increases because the Battery Management System (BMS) protects the pack, as you can see from this EV charging speed chart:
For older EVs, results are even more diverse. Around ten years ago, 50 kW was basically the industry standard for both cars and chargers. And charging curves were not as optimised as in today’s EVs.
So even if your calculator assumes “150 kW” just because you picked a 150 kW charger from a dropdown menu, it may be over-optimistic by a wide margin, depending on your car.
The charging curve: why the end 80–100% part feels so slow
Charging is not linear. Almost every EV follows some version of this pattern:
- Low State of Charge (SoC) (at 0–10%): sometimes limited to protect the pack or because the voltage is low.
- Mid SoC (roughly 10–50/60%): this is usually the fastest part of the curve.
- Higher SoC (60–80%): power starts to taper down.
- Very high SoC (80–100%): the car slows charging significantly to protect battery health.
That tapering of the charging speed is intentional. As the battery fills, the cells become more sensitive, so the BMS gradually reduces current to keep the pack healthy over many years.
Most calculators:
- Treat your entire session as if you were charging at one constant power.
- Don’t distinguish between going 20–60% (fast) and 60–100% (much slower).
So if the EV charging speed calculator promises “20–90% in 30 minutes,” it’s probably assuming an average power that you’ll only see in the sweet-spot middle of the curve. The last 10–20% can easily take as long as the first 40–50%.
Eleport EV roadtrip tip: For trip planning on DC fast chargers, it’s usually more time-efficient to drive your battery to be emptier, and charge only up to ~60–70% even if it means more charge stops, instead of staying plugged in until 90–100% every time.
400 V vs 800 V: your pack voltage matters

One of the factors affecting EV charging speed is a technical detail that calculators often ignore: battery voltage.
Most EVs on European roads today use 400 V architectures. Some newer models (including premium or performance EVs) use 800 V packs.
Modern high-power chargers are built to handle both, but keep in mind that a charger that advertises “up to 360 kW” might only deliver around 180 kW to a 400 V car, simply because power (kW) is the product of current × voltage.
That means that an 800V EV might briefly see figures close to the charger’s max kW, while your 400V EV, at the same unit, may top out at half that, even with the same SoC and temperature.
Battery temperature: the invisible speed limiter
What has the strongest influence among factors affecting EV charging speed? Most EV owners already know this – you’ll need to be aware of the temperature to estimate the charging time accurately.
And you don’t need snow to start thinking Why does EV charging slow down. In practice, things start to change when temperatures drop below roughly +10°C. Batteries, like people, are happiest somewhere in the middle of the temperature swings.
The ideal temperature range for battery performance is around 20–25°C. Some manufacturers (for example, Tesla) even heat the pack to close to 50°C during fast charging to maximise performance.
When the battery pack is cold when you start charging:
- Internal resistance increases.
- The BMS limits charging current to protect the cells.
- Your “150 kW” charger might briefly show 30–60 kW, then ramp up as the pack warms.
When the battery pack is very hot (after repeated fast charges or in a heatwave), the system may again throttle power to avoid overheating. Most battery packs these days have built-in active cooling, but there are also widely spread EVs like the Nissan LEAF that don’t have active cooling at all.
Preconditioning the battery vs “just driving there”
Is it enough to get the cabin warm and do 20–30 minutes of driving to heat the battery? It usually isn’t.
Most modern EVs can precondition the battery pack. If you set your car’s in-built navigation to the charger, most newer models start heating (or cooling) the battery to its optimal temperature before you arrive.
For best results, this should start roughly 30 minutes before your planned stop.
Driving itself, or using the cabin climate, changes battery temperature very little. That’s why we emphasise preconditioning in our winter charging guide.
The online charging time calculators tend to calculate for the ideal temperature, so this is yet another one of the factors affecting EV charging speed that you should consider when estimating your charging time. And not only that, but these charging temperatures can also end up being factors influencing EV charging costs.
Charger side limitations: shared power, smart chargers

Even if your car and the charger are technically capable of high power, the charging site itself may be the bottleneck.
Dynamic load management
Charging operators are increasingly using smart chargers that can dynamically share power between plugs when more than one car is connected.
For example, a charging site that has a 200 kW connection over four fast charging bays might design their system as either 4 x 50kW charging points, or have the option of sharing that power between the chargers dynamically, so if there is one EV charging, it would deliver the full 200 kW to the car.
This is a feature, not a bug. It lets charging point operators install more chargers in more locations where grid power is limited, and it automatically balances power so that everyone gets a fair share.
But it is another one of the factors affecting EV charging speed that you, as an EV driver, should be aware of when estimating your charging time.
AC charging at home, workplace, or destination charging: why your “22 kW” charging point might give you just 7.4 kW in reality
Calculators also tend to overestimate AC charging, especially at home or at destination chargers. The key limit here is your car’s onboard AC charger, as most modern EVs in Europe have 11 kW onboard chargers. Some older or smaller models are limited to 7.4 kW or even 3.7 kW.
Why is my EV charging so slow? When it comes to AC charging, if the wallbox or public AC charger is rated at 22 kW, but your car has an 11 kW onboard charger, you will never see more than 11 kW.
There may also be cable limits: a portable cable rated at 10 A or 16 A can limit power even if the outlet or car could support more. Also, some home installations are restricted by the household connection size or local regulations.
So when trying to estimate the time it takes to charge your EV at the AC charger, be sure to know these limitations. Luckily, the battery temperature and charging curves don’t play a role in these situations.
How to be smart about calculating your EV charging time
After all this, you might wonder if online charging calculators are useless. They’re not. They’re very helpful if you treat them as idealised scenarios rather than promises.
Here’s how to get the most from them:
- Add a time buffer.
Take whatever the calculator tells you and add 20–30% extra time, especially in winter or at busy HPDC sites. - Stay in the “fast” SoC window.
Plan your DC charging around low-to-mid SoC up to ~60–70%, instead of always pushing to 90–100%. That’s where your car is fastest. - Check your car’s actual limits.
Look up your car’s maximum DC and AC charging power, and make sure the calculator reflects that – not just the charger rating. - Consider site occupancy.
If many cars are already plugged in, depending on the charging location, you can expect lower power from shared infrastructure and grid limits. - Use your car’s navigation for fast charging.
Built-in EV routing that preconditions the battery for HPDC stops usually gives a more realistic estimate than generic web tools, because your car actually knows its own battery status and temperature. - Be extra-kind to your time in winter.
In colder months, combine the calculator estimate with simple winter best practices: precondition ~30 minutes before arrival, keep some SoC buffer, and avoid letting the battery sit at very low charge in extreme cold.
By the way, depending on the steps taken, you can not only speed up your overall time spent charging, but more often than not, these are also factors influencing EV charging costs.
We’re here to narrow the gap between the ideal “calculator” time and reality
We can’t control the weather or your car’s exact charging curve.
But as a charging operator, Eleport can design our infrastructure and software so your real-world experience is as predictable and smooth as possible. Across the Eleport network, we make sure that we deliver as much power to your EV as possible, even if you experience any of the limitations above – and we make sure to deploy enough DC fast chargers across our Central and Eastern European countries to make sure the coverage is there.
Once you understand all these extra factors affecting EV charging speed, you won’t have to think of the options on how to fix slow charging anymore; your charging sessions will instead feel less like a surprise – and much more like a plan.